Navigating The Phoenix Housing Market

Welcome to the official blog of Dominion Group Properties—your trusted resource for real estate news, market analysis, and expert guidance across Phoenix, Scottsdale, North Phoenix, Cave Creek, Carefree, and Anthem. Whether you're a home buyer, seller, investor, or planning a relocation within the Valley, our blog delivers timely content to keep you informed.

What We Cover

  • Local Market Trends & Housing Reports: Stay updated with monthly insights on inventory, pricing, and market shifts in Phoenix and the North Valley.
  • Home Buying & Selling Strategies: From financing manufactured homes to pricing historic properties, our articles cover every step of the process.
  • Community & Development News: Learn about upcoming neighborhoods like Desert Hills, emerging job centers, and how primed areas are shaping investment opportunities.
  • Property Management & Landlord Tips: Make informed decisions whether you're leasing, investing, or managing a residential property in Arizona.

Why Our Blog Stands Out

  • Content anchored in real-world market data and local expertise across Phoenix Metro and surrounding regions.
  • Written and curated by Jonathan Baer—broker, licensed loan officer, and real estate advisor with over 30 years’ experience and $240 million in closed transactions in Maricopa County.
  • Blog topics tailored for actionable insights, whether flipping a home in Cave Creek, planning a move to Anthem, or financing a manufactured home in Phoenix.

Bookmark this page and check back regularly for fresh updates, expert commentary, and smart strategies for navigating Arizona’s dynamic real estate market.

About the Author:
Jonathan Baer, Designated Broker and Real Estate Wealth Advisor at Dominion Group Properties, has completed over 1,000 transactions worth more than $240 million across Arizona.


Learn More About Jonathan Baer

Feb. 22, 2024

Don’t Let the Latest Home Price Headlines Confuse You

Don’t Let the Latest Home Price Headlines Confuse You


Based on what you’re hearing in the news about home prices, you may be worried they’re falling. But here’s the thing. The headlines aren’t giving you the full picture.

If you look at the national data for 2023, home prices actually showed positive growth for the year. While this varies by market, and while there were some months with slight declines nationally, those were the exception, not the rule.

The overarching story is that prices went up last year, not down. Let’s dive into the data to set the record straight. 

2023 Was the Return to More Normal Home Price Growth

If anything, last year marked a return to more normal home price appreciation. To prove it, here’s what usually happens in residential real estate.

In the housing market, there are predictable ebbs and flows that take place each year. It’s called seasonality. It goes like this. Spring is the peak homebuying season when the market is most active. That activity is usually still strong in the summer, but begins to wane toward the end of the year. Home prices follow along with this seasonality because prices grow the most when there’s high demand.

The graph below uses data from Case-Shiller to show how this pattern played out in home prices from 1973 through 2022 (not adjusted, so you can see the seasonality):
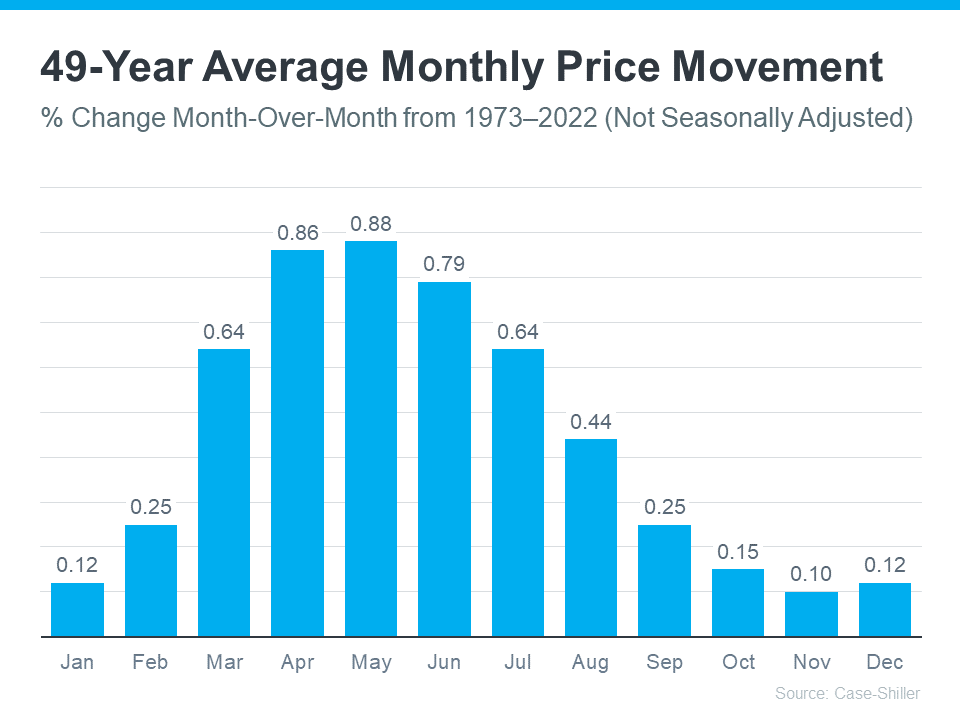


As the data shows, for nearly 50 years, home prices match typical market seasonality. At the beginning of the year, home prices grow more moderately. That’s because the market is less active as fewer people move in January and February. Then, as the market transitions into the peak homebuying season in the spring, activity ramps up. That means home prices do too. Then, as fall and winter approach, activity eases again and prices grow, just at a slower rate.

Now, let’s layer the data that’s come out for 2023 so far (shown in green) on top of that long-term trend (still shown in blue). That way, it’s easy to see how 2023 compares.
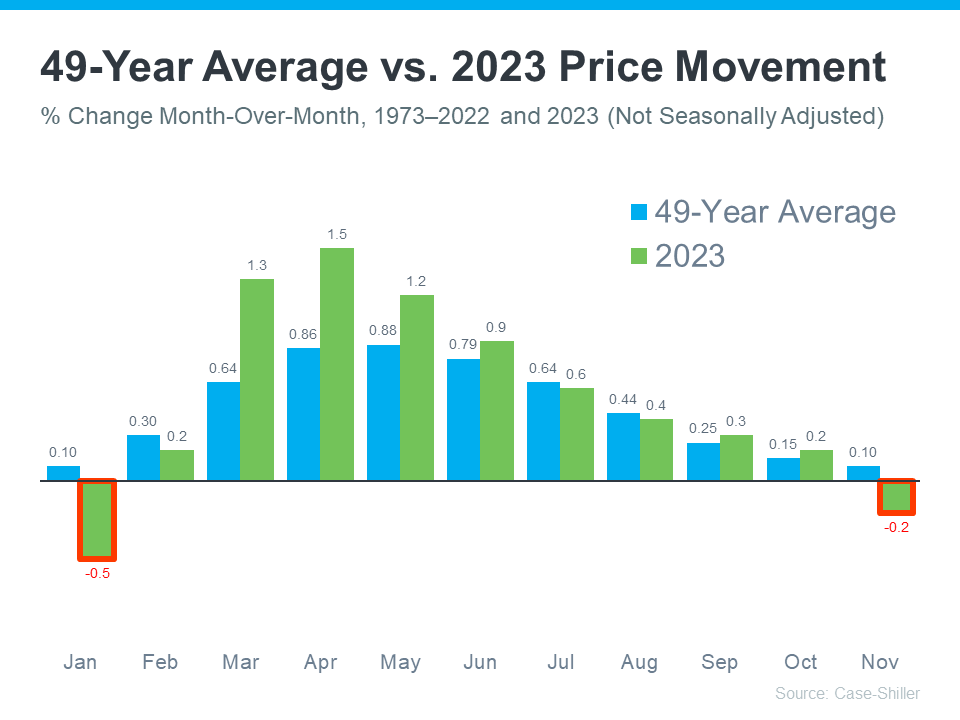
 

As the graph shows, moving through the year in 2023, the level of appreciation fell more in line with the long-term trend for what usually happens in the housing market. You can see that in how close the green bars come to matching the blue bars in the later part of the year.

But the headlines only really focused on the two bars outlined in red. Here’s the context you may not have gotten that can really put those two bars into perspective. The long-term trend shows it’s normal for home prices to moderate in the fall and winter. That’s typical seasonality.

And since the 49-year average is so close to zero during those months (0.10%), that also means it’s not unusual for home prices to drop ever so slightly during those times. But those are just blips on the radar. If you look at the year as a whole, home prices still rose overall.

What You Really Need To Know

Headlines are going to call attention to the small month-to-month dips instead of the bigger year-long picture. And that can be a bit misleading because it’s only focused on one part of the whole story.

Instead, remember last year we saw the return of seasonality in the housing market – and that’s a good thing after home prices skyrocketed unsustainably during the ‘unicorn’ years of the pandemic.

And just in case you’re still worried home prices will fall, don’t be. The expectation for this year is that prices will continue to appreciate as buyers re-enter the market due to mortgage rates trending down compared to last year. As buyer demand goes up and more people move at the same time the supply of homes for sale is still low, the upward pressure on prices will continue.

Bottom Line

Don’t let home price headlines confuse you. The data shows that, as a whole, home prices rose in 2023. If you have questions about what you’re hearing in the news or about what’s happening with home prices in our local area, let’s connect.

Posted in Market Updates
Feb. 20, 2024

Bridging the Gaps on the Road to Homeownership

Bridging the Gaps on the Road to Homeownership


Homeownership is a major part of the American Dream. But, the path to achieving this dream can be quite difficult. While progress has been made to improve fair housing access, households of color still face unique challenges on the road to owning a home. Working with the right real estate experts can make all the difference for diverse buyers.

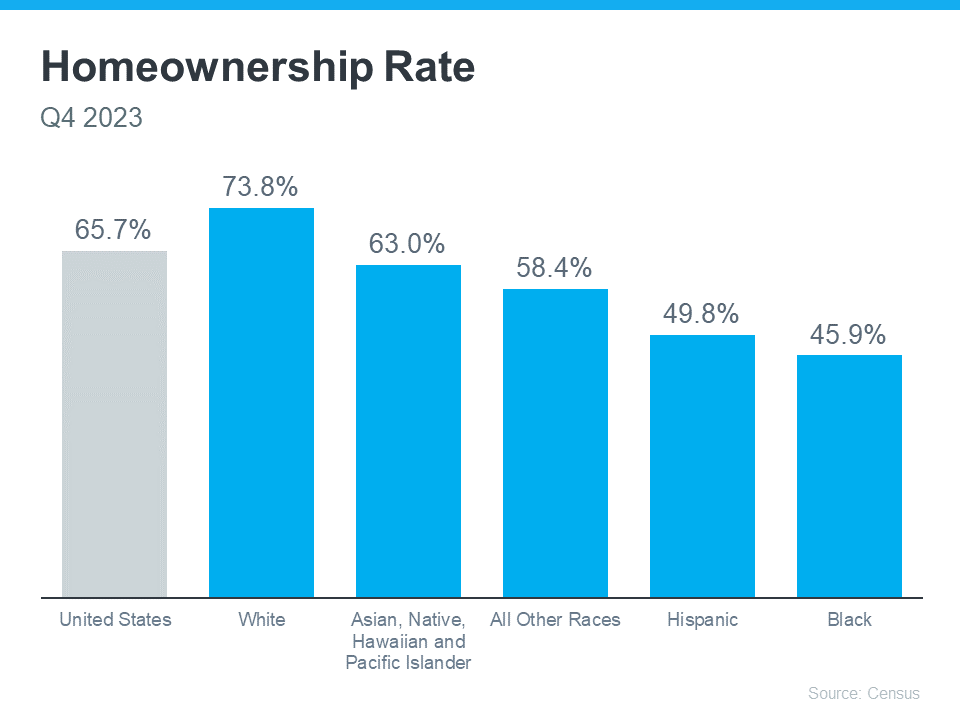
It's clear that achieving homeownership is more challenging for certain groups because there’s still a measurable gap between the overall average U.S. homeownership rate and that of non-white groups. Today, Black households continue to have the lowest homeownership rate nationally (see graph below):


Homeownership is an important part of building household wealth that can be passed down to future generations. According to a report by the National Association of Realtors (NAR), almost half of Black homebuyers in 2023 were first-time buyers. That means many didn’t have home equity they could use toward their home purchase.

That financial hurdle alone makes buying a home more challenging, especially at a time when affordability is a major concern for first-time buyers. Jessica Lautz, Deputy Chief Economist at NAR says:

“It’s an incredibly difficult market for all home buyers right now, especially first-time home buyers and especially first-time home buyers of color.”

Because of these challenges, there are several down payment assistance programs specifically aimed at helping minority buyers fulfill their homeownership dreams:

  • The 3By30 program offers valuable resources for Black buyers, making it easier for them to secure a down payment and buy a home.
  • For Native Americans, Down Payment Resource highlights 42 U.S. homebuyer assistance programs across 14 states that make homeownership more attainable by providing support with down payments and other costs.
  • Fannie Mae provides down payment assistance to eligible first-time homebuyers living in Latino communities.

Even if you don’t qualify for these programs, there are many other federal, state, and local options available to look into. And a real estate professional can help you find the ones that best meet your needs.

For minority homebuyers, the challenges that remain can be a point of pain and frustration. That’s why it’s so important for members of diverse groups to have the right team of experts on their sides throughout the homebuying process. These professionals aren’t only experienced advisors who understand the market and give the best advice, they’re also compassionate educators who will advocate for your best interests every step of the way.

Bottom Line

Let’s connect to make sure you have the information and support you need as you walk the path to homeownership.

Feb. 15, 2024

February 2024 Phoenix Real Estate Market Update

In the real estate market, there are several key metrics that buyers and sellers should pay attention to. These metrics provide valuable insights into the dynamics of the market and can help inform decisions related to buying or selling a property. Let's dive into the correlation between some of these metrics to better understand the current state of the market.

Firstly, let's look at the "Months Supply of Inventory" metric, which currently stands at 3.15. This metric represents the number of months it would take to sell all the homes currently on the market, assuming no new listings are added. A lower number indicates a seller's market, where demand exceeds supply, while a higher number suggests a buyer's market, where supply outpaces demand.

Now, let's consider the "12-Month Change in Months of Inventory," which shows a significant increase of +20.69%. This change indicates that the supply of homes on the market has increased over the past year. This could suggest a shift towards a buyer's market or a slowdown in demand, potentially giving buyers more options and negotiating power.

Another important metric to consider is the "Median Days Homes are On the Market," which currently stands at 53. This figure represents the average number of days it takes for a home to sell once it is listed. A lower number suggests a faster-paced market with high demand, while a higher number indicates a slower market with fewer buyers. In this case, 53 days is relatively moderate, indicating a balanced market where buyers and sellers have relatively equal bargaining power.

Moving on, the "List to Sold Price Percentage" is an essential metric for sellers. At 97.8%, this percentage signifies that, on average, homes are selling for approximately 97.8% of their list price. A higher percentage suggests that sellers are receiving offers closer to their asking price, which can indicate strong buyer competition and a seller's market.

Lastly, we have the "Median Sold Price" of $455,000. This metric represents the middle point of all the sold prices within a given time period. It is important for both buyers and sellers to be aware of the median sold price in their area, as it provides a general idea of the market's price range. In this case, the median sold price is $455,000, suggesting that this is the midpoint for home prices in the current market.

When we examine these metrics together, we can see some interesting correlations. The increase in the months supply of inventory suggests a potential shift towards a buyer's market or a slowdown in demand. This is further supported by the relatively moderate median days homes are on the market, indicating a balanced market. However, the list to sold price percentage remains high, indicating that sellers are still getting offers close to their asking price.

For buyers, these metrics suggest that there are more options available with a potentially reduced level of competition. This could provide an opportunity to negotiate better deals and potentially find a home closer to their desired price range.

On the other hand, sellers should be mindful of the increase in supply and adjust their pricing and marketing strategies accordingly. While homes are still selling at a high percentage of their list price, it may be necessary for sellers to be realistic with their pricing expectations to attract potential buyers in a slightly more competitive market.

In conclusion, understanding these real estate metrics provides valuable insights for both buyers and sellers. By considering the months supply of inventory, the change in inventory over time, the median days homes are on the market, the list to sold price percentage, and the median sold price, individuals can make more informed decisions in the real estate market.
Active Listings

Closed Listings

Posted in Market Updates
Feb. 15, 2024

What’s Really Happening with Mortgage Rates?

What’s Really Happening with Mortgage Rates?


Are you feeling a bit unsure about what’s really happening with mortgage rates? That might be because you’ve heard someone say they’re coming down. But then you read somewhere else that they’re up again. And that may leave you scratching your head and wondering what’s true.

The simplest answer is: that what you read or hear will vary based on the time frame they’re looking at. Here’s some information that can help clear up the confusion.

Mortgage Rates Are Volatile by Nature

Mortgage rates don’t move in a straight line. There are too many factors at play for that to happen. Instead, rates bounce around because they’re impacted by things like economic conditions, decisions from the Federal Reserve, and so much more. That means they might be up one day and down the next depending on what’s going on in the economy and the world as a whole.

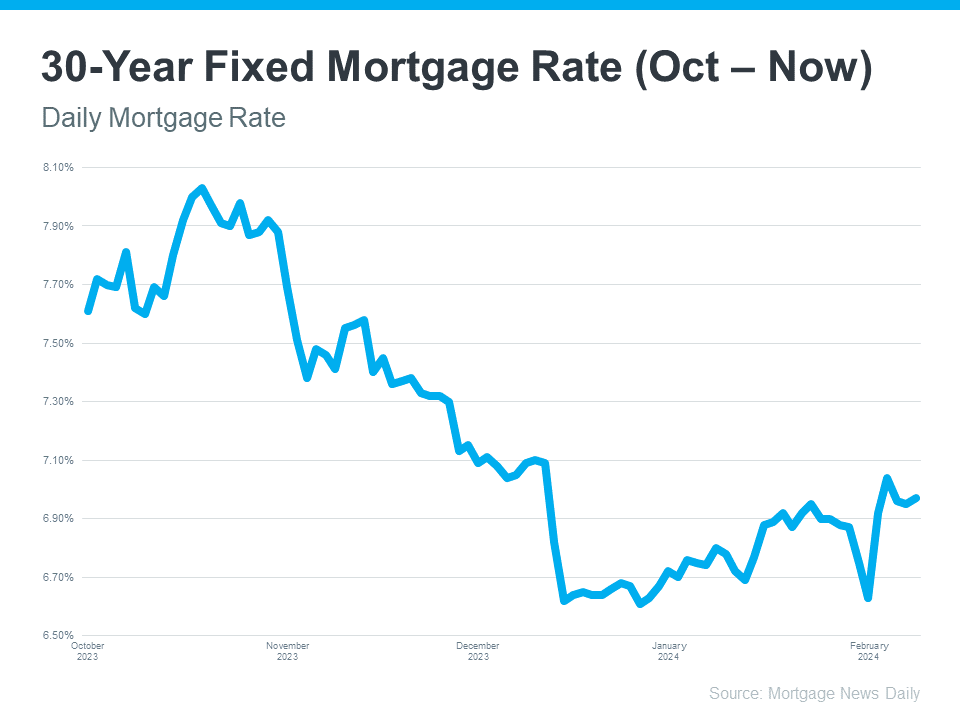
Take a look at the graph below. It uses data from Mortgage News Daily to show the ebbs and flows in the 30-year fixed mortgage rate since last October:


If you look at the graph, you’ll see a lot of peaks and valleys – some bigger than others. And when you use data like this to explain what’s happening, the story can be different based on which two points in the graph you’re comparing.

For example, if you’re only looking at the beginning of this month through now, you may think mortgage rates are on the way back up. But, if you look at the latest data point and compare it to the peak in October, rates have trended down. So, what’s the right way to look at it?

The Big Picture

Mortgage rates are always going to bounce around. It’s just how they work. So, you shouldn’t focus too much on the small, daily changes. Instead, to really understand the overall trend, zoom out and look at the big picture.

When you look at the highest point (October) compared to where rates are now, you can see they’ve come down compared to last year. And if you’re looking to buy a home, this is big news. Don’t let the little blips distract you. The experts agree, overall, that the larger downward trend could continue this year

Bottom Line

Let’s connect if you have any questions about what you’re reading or hearing about the housing market.

Posted in Market Updates
Feb. 12, 2024

The Perks of Selling Your House When Inventory Is Low

The Perks of Selling Your House When Inventory Is Low


When it comes to selling your house, you’re probably trying to juggle the current market conditions and your own needs as you plan your move.

One thing that may be working in your favor is how few homes there are for sale right now. Here’s what you need to know about the current inventory situation and what it means for you.

The Supply of Homes for Sale Is Far Below the Norm

When you’re selling something, it helps if what you’re selling is in demand, but is also in low supply. Why? That makes it even more desirable since there’s not enough to go around. That’s exactly what’s happening in the housing market today. There are more buyers looking to buy than there are homes for sale.

To tell the story of just how low inventory is, here’s the latest information on active listings, or homes available for sale. The graph below uses data from Realtor.com to show how many active listings there were in September of this year compared to what’s more typical in the market.


As you can see in the graph, if you look at the last normal years for the market (shown in the blue bars) versus the latest numbers for this year (shown in the red bar), it’s clear inventory is still far lower than the norm.

What That Means for You

Buyers have fewer choices now than they did in more typical years. And that’s why you could still see some great perks if you sell today. Because there aren’t enough homes to go around, homes that are priced right are still selling fast and the average seller is getting multiple offers from eager buyers. Based on the latest data from the Confidence Index from the National Association of Realtors (NAR):

  • 69% of homes sold in less than a month.
  • 2.6 offers: the average number of offers on recently sold homes.

An article from Realtor.com also explains how the limited number of houses for sale benefits you if you’re selling:

“. . . homes spent two weeks less on the market this past month than they did in the average September from 2017 to 2019 . . . as still-limited supply spurs homebuyers to act quickly . . .”

Bottom Line

Because the supply of homes for sale is so low, buyers desperately want more options – and your house may be just what they’re looking for. Let’s connect to get your house listed at the right price for today’s market. You could still see it sell quickly and potentially get multiple offers.

Posted in Home Selling
Feb. 9, 2024

Foreclosure Activity Is Still Lower than the Norm

Foreclosure Activity Is Still Lower than the Norm


Have you seen headlines talking about the increase in foreclosures in today’s housing market? If so, they may leave you feeling a bit uneasy about what’s ahead. But remember, these clickbait titles don’t always give you the full story.

The truth is, if you compare the current numbers with what usually happens in the market, you’ll see there’s no need to worry.

Putting the Headlines into Perspective

The increase the media is calling attention to is misleading. That’s because they’re only comparing the most recent numbers to a time where foreclosures were at historic lows. And that’s making it sound like a bigger deal than it is.

In 2020 and 2021, the moratorium and forbearance program helped millions of homeowners stay in their homes, allowing them to get back on their feet during a very challenging period.

When the moratorium came to an end, there was an expected rise in foreclosures. But just because foreclosures are up doesn’t mean the housing market is in trouble.

Historical Data Shows There Isn’t a Wave of Foreclosures

Instead of comparing today’s numbers with the last few abnormal years, it’s better to compare to long-term trends – specifically to the housing crash – since that’s what people worry may happen again.

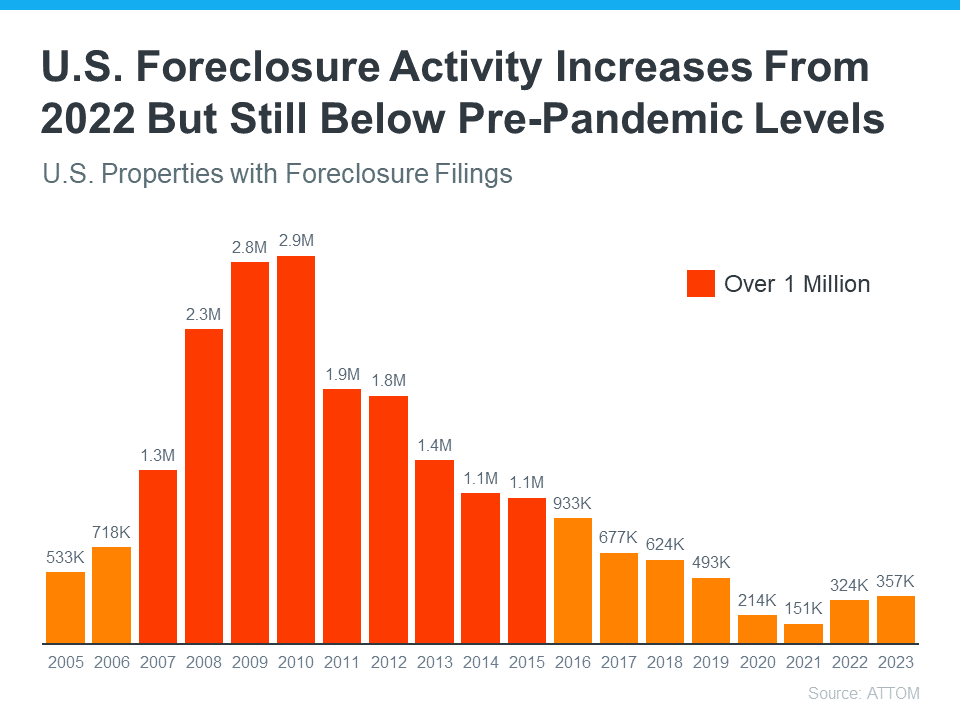
Take a look at the graph below. It uses foreclosure data from ATTOM, a property data provider, to show foreclosure activity has been consistently lower (shown in orange) since the crash in 2008 (shown in red):


So, while foreclosure filings are up in the latest report, it’s clear this is nothing like it was back then.

In fact, we’re not even back at the levels we’d see in more normal years, like 2019. As Rick Sharga, Founder and CEO of the CJ Patrick Companyexplains:

Foreclosure activity is still only at about 60% of pre-pandemic levels. . .”

That’s largely because buyers today are more qualified and less likely to default on their loans. Delinquency rates are still low and most homeowners have enough equity to keep them from going into foreclosure. As Molly Boesel, Principal Economist at CoreLogic, says:

“U.S. mortgage delinquency rates remained healthy in October, with the overall delinquency rate unchanged from a year earlier and the serious delinquency rate remaining at a historic low… borrowers in later stages of delinquencies are finding alternatives to defaulting on their home loans.”

The reality is, while increasing, the data shows a foreclosure crisis is not where the market is today, or where it’s headed.

Bottom Line

Even though the housing market is experiencing an expected rise in foreclosures, it’s nowhere near the crisis levels seen when the housing bubble burst. If you have questions about what you’re hearing or reading about the housing market, let’s connect.

Posted in Market Updates
Feb. 7, 2024

2 of the Factors That Impact Mortgage Rates

2 of the Factors That Impact Mortgage Rates


If you’re looking to buy a home, you’ve probably been paying close attention to mortgage rates. Over the last couple of years, they hit record lows, rose dramatically, and are now dropping back down a bit. Ever wonder why?

The answer is complicated because there’s a lot that can influence mortgage rates. Here are just a few of the most impactful factors at play.

Inflation and the Federal Reserve

The Federal Reserve (Fed) doesn’t directly determine mortgage rates. But the Fed does move the Federal Funds Rate up or down in response to what’s happening with inflation, the economy, employment rates, and more. As that happens, mortgage rates tend to respond. Business Insider explains:

The Federal Reserve slows inflation by raising the federal funds rate, which can indirectly impact mortgages. High inflation and investor expectations of more Fed rate hikes can push mortgage rates up. If investors believe the Fed may cut rates and inflation is decelerating, mortgage rates will typically trend down.”

Over the last couple of years, the Fed raised the Federal Fund Rate to try to fight inflation and, as that happened, mortgage rates jumped up, too. Fortunately, the expert outlook for inflation and mortgage rates is that both should become more favorable over the course of the year. As Danielle Hale, Chief Economist at Realtor.comsays:

“[M]ortgage rates will continue to ease in 2024 as inflation improves . . .”

There’s even talk the Fed may actually cut the Fed Funds Rate this year because inflation is cooling, even though it’s not yet back to their ideal target.

The 10-Year Treasury Yield

Additionally, mortgage companies look at the 10-Year Treasury Yield to decide how much interest to charge on home loans. If the yield goes up, mortgage rates usually go up, too. The opposite is also true. According to Investopedia:

“One frequently used government bond benchmark to which mortgage lenders often peg their interest rates is the 10-year Treasury bond yield.”

Historically, the spread between the 10-Year Treasury Yield and the 30-year fixed mortgage rate has been fairly consistent, but that’s not the case recently. That means, there’s room for mortgage rates to come down. So, keeping an eye on which way the treasury yield is trending can give experts an idea of where mortgage rates may head next.

Bottom Line

With the Fed meeting later this week, experts in the industry will be keeping a close watch to see what they decide and what impact it’ll have on the economy. To navigate any mortgage rate changes and their impact on your moving plans, it’s best to have a team of professionals on your side.

Feb. 5, 2024

Will a Silver Tsunami Change the 2024 Housing Market?

Will a Silver Tsunami Change the 2024 Housing Market?


Have you ever heard the term “Silver Tsunami” and wondered what it's all about? If so, that might be because there’s been lot of talk about it online recently. Let's dive into what it is and why it won't drastically impact the housing market.

What Does Silver Tsunami Mean?

A recent article from HousingWire calls it:

“. . . a colloquialism referring to aging Americans changing their housing arrangements to accommodate aging . . .”

The thought is that as baby boomers grow older, a significant number will start downsizing their homes. Considering how large that generation is, if these moves happened in a big wave, it would affect the housing market by causing a significant uptick in the number of larger homes for sale. That influx of homes coming onto the market would impact the balance of supply and demand and more.

The concept makes sense in theory, but will it happen? And if so, when?

Why It Won’t Have a Huge Impact on the Housing Market in 2024

Experts say, so far, a silver tsunami hasn’t happened – and it probably won't anytime soon. According to that same article from HousingWire:

“. . . the silver tsunami’s transformative potential for the U.S. housing market has not yet materialized in any meaningful way, and few expect it to anytime soon.”

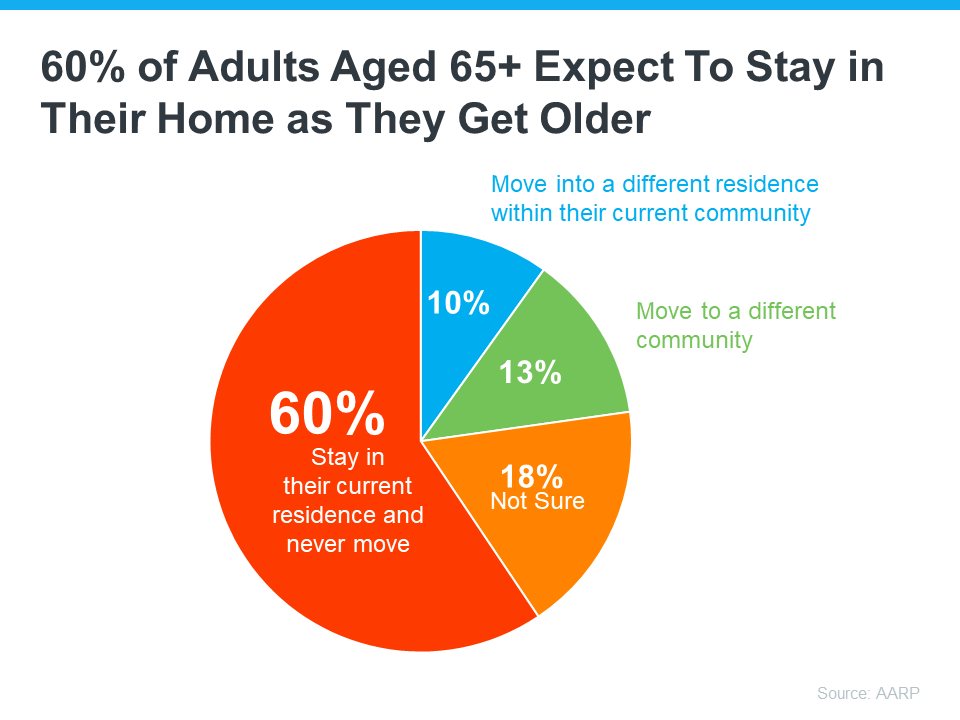
Here’s just one reason why. Many baby boomers don’t want to move. Data from the AARP shows over half of the surveyed adults ages 65 and up plan to stay put and age in place in their current home rather than move (see chart below):


Clearly, not every baby boomer is planning to sell or move – and even those who do won’t do it all at once. Instead, it will be more gradual, happening slowly over time. As Mark Fleming, Chief Economist at First Americansays:

Demographics are never a tsunami. The baby boomer generation is almost two decades of births. That means they're going to take about two decades to work their way through.”

Bottom Line

If you’re worried about a Silver Tsunami shaking up the housing market, don’t be. Any impact from baby boomers moving will be gradual over many years. Fleming sums it up best:


“Demographic trends, they don't tsunami. They trickle.”
Feb. 2, 2024

Are More Homeowners Selling as Mortgage Rates Come Down?

Are More Homeowners Selling as Mortgage Rates Come Down?


If you’re looking to buy a home, the recent downward trend in mortgage rates is good news because it helps with affordability. But there’s another way this benefits you – it may inspire more homeowners to put their houses up for sale.

The Mortgage Rate Lock-In Effect

Over the past year, one factor that’s really limited the options for your move is how few homes were on the market. That’s because many homeowners chose to delay their plans to sell once mortgage rates went up. An article from Freddie Mac explains:

The lack of housing supply was partly driven by the rate lock-in effect. . . . With higher rates, the incentive for existing homeowners to list their property and move to a new house has greatly diminished, leaving them rate locked.”

These homeowners decided to stay put and keep their current lower mortgage rate, rather than move and take on a higher one on their next home.

Early Signs Show Those Homeowners Are Ready To Move Again

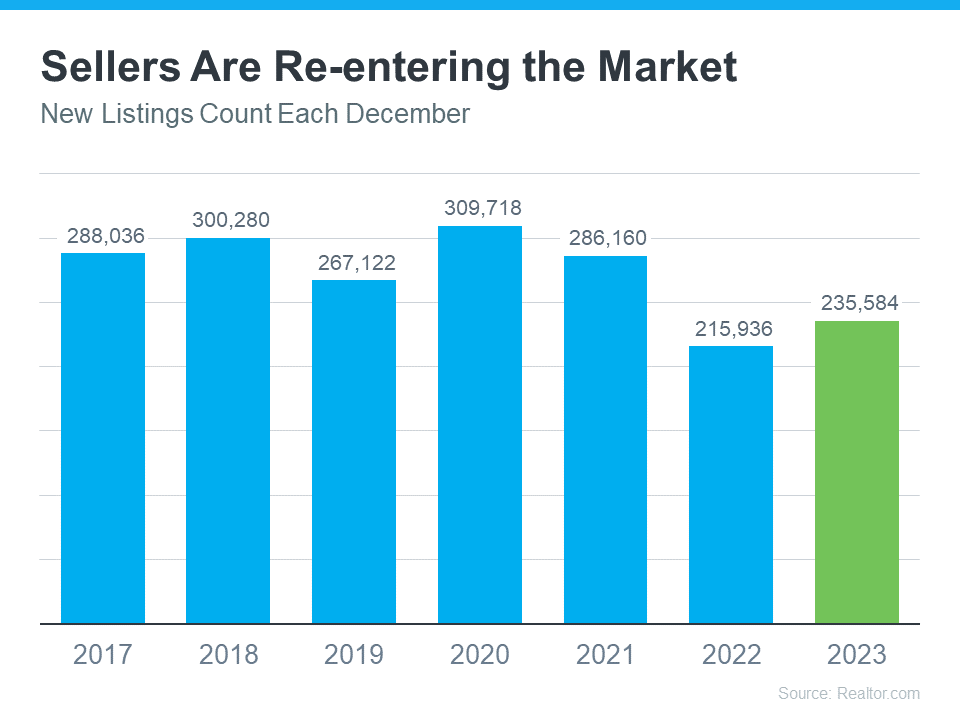
According to the latest data from Realtor.com, there were more homeowners putting their houses up for sale, known in the industry as new listings, in December 2023 compared to December 2022 (see graph below):


Here's why this is so significant. Typically, activity in the housing market cools down in the later months of the year as some sellers choose to delay their moves until January rolls around.

This is the first time since 2020 that we’ve seen an uptick in new listings this time of year. This could be a signal that the rate lock-in effect is easing a bit in response to lower rates.

What This Means for You

While there isn’t going to suddenly be an influx of options for your home search, it does mean more sellers may be deciding to list. According to a recent article from the Joint Center for Housing Studies (JCHS):

A reduction in interest rates could alleviate the lock-in effect and help lift homeowner mobility. Indeed, interest rates have recently declined, falling by a full percentage point from October to November 2023 . . . Further decreases would reduce the barrier to moving and give homeowners looking to sell a newfound sense of urgency . . .”

And that means you may see more homes come onto the market to give you more fresh options to choose from.

Bottom Line

As mortgage rates come down, more sellers may re-enter the market – that gives you an opportunity to find the home you’re looking for. Let’s connect so you’ve got a local expert on your side who’ll help you stay on top of the latest listings in our area.

Jan. 31, 2024

Experts Project Home Prices Will Increase in 2024

Experts Project Home Prices Will Increase in 2024


Even though home prices are going up nationally, some people are still worried they might come down. In fact, a recent survey from Fannie Mae found that 24% of people think home prices will actually decline over the next 12 months. That means almost one out of every four people are dealing with that fear, and you might be, too.

To help ease that concern, here's what experts forecast will happen with prices this year.

Experts Project a Modest Increase

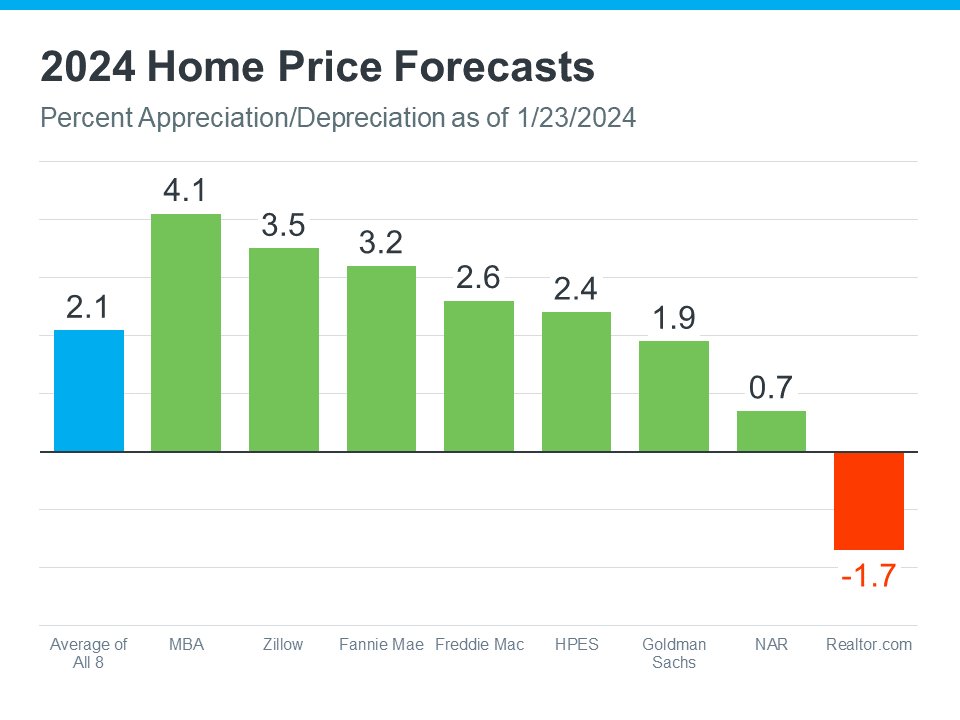
Check out the latest home price forecasts from eight different sources (see graph below):


The blue bar on the left means, on average, experts think home prices will go up over 2% by the end of this year – not down.

Prices aren’t likely to depreciate in 2024 because inventory is still tight and lower mortgage rates are leading to strong buyer demand. Those two factors will keep pushing prices up as the year goes on. As Selma Hepp, Chief Economist at CoreLogicexplains:

“With mortgage rates dropping, demand for homes in early 2024 is likely to be strong and will again put pressure on prices, similar to trends observed in early 2023 . . . Most markets will continue to reach new home price highs over the course of 2024.

What Does This Mean for You?

Experts are saying home prices will go up this year, and that's good news if you're thinking about buying a home. When you become a homeowner, you want the value of your house to go up. That appreciation is what builds equity and makes homeownership such a good investment over time.

Beyond that, expected home price appreciation also means if you’re ready, willing, and able to buy, waiting just means it will cost more later. 

Bottom Line

If you're worried home prices will come down, don’t be. Many experts believe they’ll actually go up this year. If you have questions or worries about what’s happening with prices in our area, let’s connect.