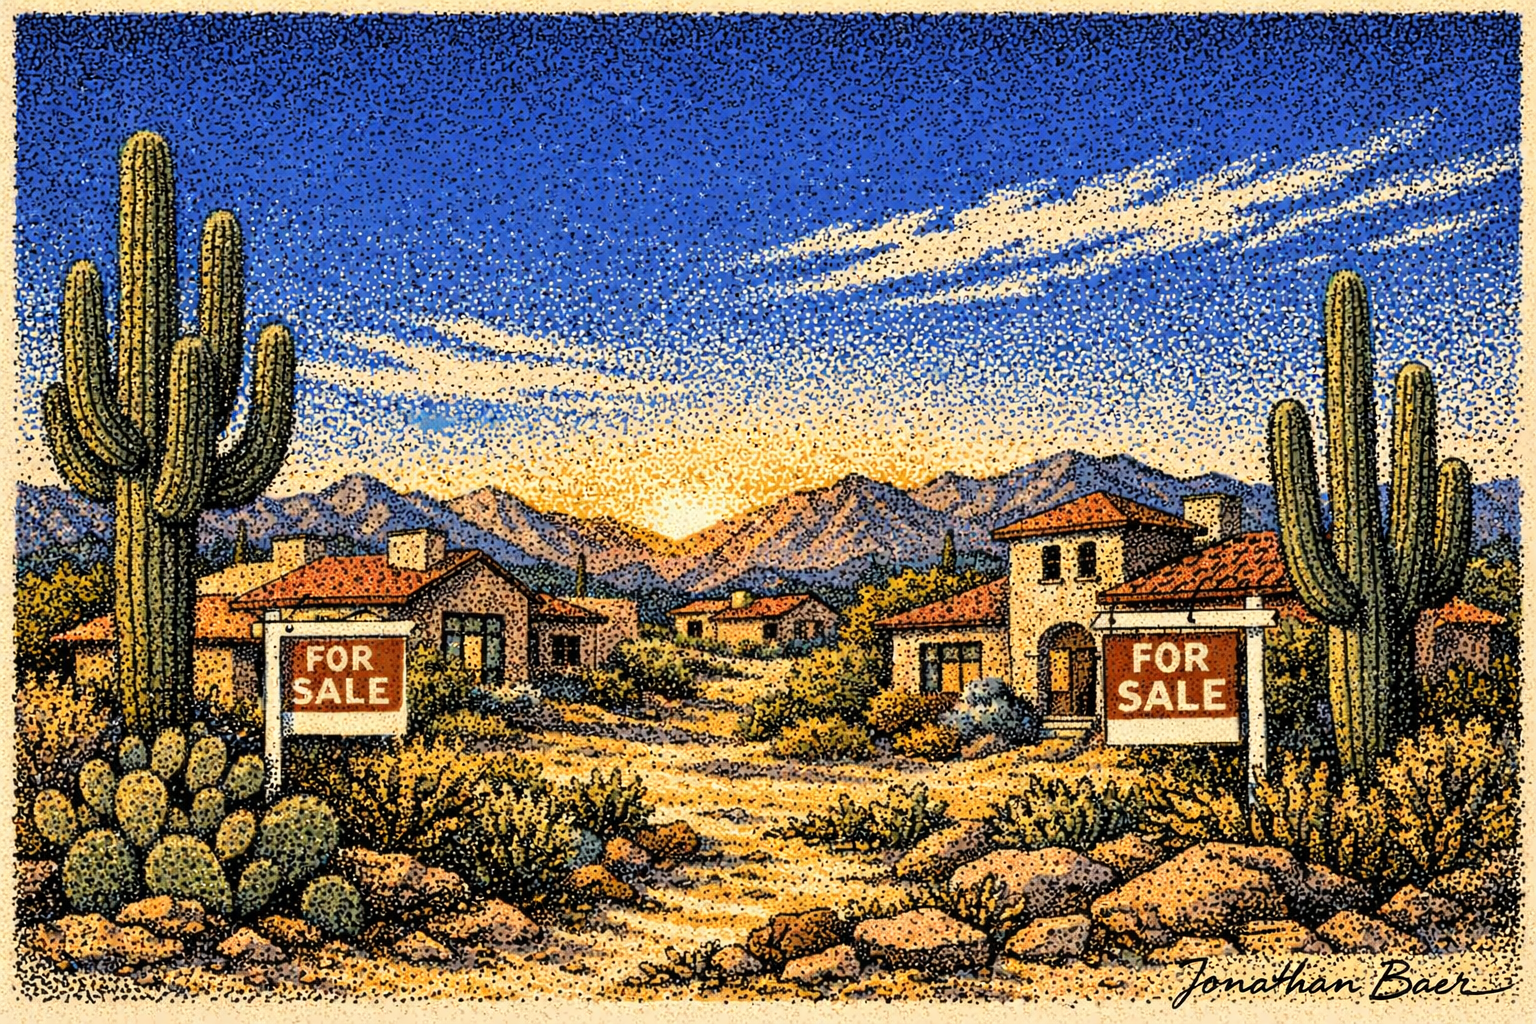
A New Year, a New Market Reality: Phoenix Housing Outlook for 2026
By Jonathan Baer, Dominion Group Properties
So… is 2026 going to be better than 2025?
That’s the question I’ve been hearing everywhere lately — from kitchen tables in Cave Creek to coffee shops in North Phoenix. Fair question. 2025 wasn’t exactly a victory lap.
Here’s the good news: as we roll into January, the housing market in Phoenix, Arizona and across Maricopa County is showing more stability than most people expected. Not fireworks. Not hysteria. Just… healthier footing. And honestly? I’ll take that all day.
January is always a leading indicator month. It doesn’t lie. And the early signals suggest we’re starting 2026 with a more grounded, realistic market — for both buyers and sellers. You following me?
What Actually Happened at the End of 2025
We finished 2025 stronger than forecasted, but not because buyers suddenly went wild. The real story was inventory.
A meaningful number of listings quietly disappeared — expired or canceled — which tightened supply without a surge in demand. Translation? Sellers tapped out, took a breather, and said, “Let’s revisit this after the holidays.”
The expectation now? Many of those sellers will reappear in January, testing buyer patience, pricing tolerance, and overall market confidence early in the year. Buckle up — politely.
Buyers Are Back… But Smarter
Buyers didn’t vanish in 2025 — they recalibrated. And now, with mortgage rates lower than much of last year, expectations have reset.
Instead of sitting on the sidelines waiting for 3% rates (spoiler: that ship sailed), buyers are engaging with today’s reality. They’re realistic. They’re prepared. And yes… they’re actually writing contracts again.
Homes priced around the $500,000 range should see improved activity — both in sales and fresh inventory. Pricing? Relatively stable out of the gate. Fewer dramatic discounts. More acceptance of where the market actually is.
Perception is reality and reality is perception.
Market Snapshot: January 1, 2026 vs. January 1, 2025
Source: The Cromford Report (ARMLS numbers), all areas and property types.
Inventory
Active Listings (excluding UCB & CCBS):
22,248 vs. 20,007 last year (+12%)
↓ 9.0% from last month
Active Listings (including UCB & CCBS):
24,837 vs. 22,196 last year (+12%)
↓ 10.3% from last month
Supply declined steadily throughout December, finishing the year down roughly 10% from late November. That said, inventory remains 12% higher than at the start of 2025, meaning buyers still have meaningful choices across most price ranges. A notable influx of new listings is expected over the next 12 weeks, particularly from homes that were recently canceled or expired.
Demand & Contracts
Pending Listings:
3,373 vs. 3,307 last year (+2.0%)
↓ 19% from last month
Under Contract Listings (Pending + UCB + CCBS):
5,782 vs. 5,496 last year (+5.2%)
↓ 20% from last month
December’s strong closing pace reduced the number of homes under contract heading into January. Even so, contract activity remains higher than this time last year, which we view as a positive signal.
Sales & Pricing
Monthly Sales:
6,374 vs. 5,576 last year (+14%)
↑ 18% from November
Average Sales Price per Sq. Ft.:
$303.80 vs. $302.98 last year (+0.3%)
↑ 2.4% month-over-month
Median Sales Price:
$455,000 vs. $450,000 last year (+1.1%)
↑ 1.1% from November
December was a surprisingly strong month for closings. While luxury homes dominated the first half of the month, more affordable properties gained traction toward year-end. With 22 working days in December 2025 (one more than December 2024), the month had a slight calendar advantage — but even adjusting for that, closings were up over 14%, making December a clear win.
Luxury sales temporarily pushed the average $/SF higher, but overall price appreciation for the year remained modest. Median prices were essentially flat, ending just $5,000 higher year-over-year, reinforcing market stability rather than exuberance.
What This Means for Buyers and Sellers
Buyers
More choices than early 2025, stable pricing, and slightly improved affordability thanks to household incomes rising faster than home prices.
Sellers
Conditions are improving compared to much of last year, but pricing discipline matters. Homes that are well-prepared and correctly priced should perform far better than those chasing yesterday’s numbers.
The Cromford Market Index is trending back toward the balanced range (90–110), signaling a healthier, more functional market.
The Bottom Line
Greater Phoenix metropolitan area has outperformed low expectations since October. January will determine whether that momentum holds. The next few weeks will reveal:
- How many sidelined sellers return
- Whether demand strengthens as rates remain lower than most of 2025
- If inventory growth stays manageable
For now, things look good for buyers — and better for sellers than they’ve seen in quite some time. But as always, January will tell the real story for 2026.
Want the truth about your situation — not a sales pitch?
Meet Jonathan Baer, Designated Broker of Dominion Group Properties | Browse the latest homes for sale in Phoenix and beyond | Check the current Phoenix housing market report